Azure Sql Server - How to find your worst performing queries
February 3, 2020 • ☕️ 1 min read
Azure Sql Server is a fantastic database engine. Azure portal gives a good overview on how it is performing. If it is performing bad you have to understand why and solve these performance issues. One the most common approaches is to get the worst performing queries and try to optimize them.
DECLARE @NumberOfQueries INT = 20

SELECT *
FROM
(
    SELECT execution_count AS ExecutionCount
    , highest_cpu_queries.total_worker_time AS TotalWorkerTime
    , (highest_cpu_queries.total_worker_time / execution_count) AS AverageCpuTime
    , total_logical_reads AS TotalReads
    , total_logical_writes AS TotalWrites
    , q.[Text] AS SqlScript
    , highest_cpu_queries.creation_time AS CreationTime
    , highest_cpu_queries.last_execution_time AS LastExecutionTime
    FROM
    (
        SELECT TOP (@NumberOfQueries) *
        FROM sys.dm_exec_query_stats qs
        ORDER BY qs.total_worker_time desc
    ) AS highest_cpu_queries
    CROSS APPLY sys.dm_exec_sql_text(plan_handle) AS q
) Queries
ORDER BY Queries.AverageCpuTime DESC
--ORDER BY Queries.TotalWorkerTime DESC
--ORDER BY Queries.ExecutionCount DESC
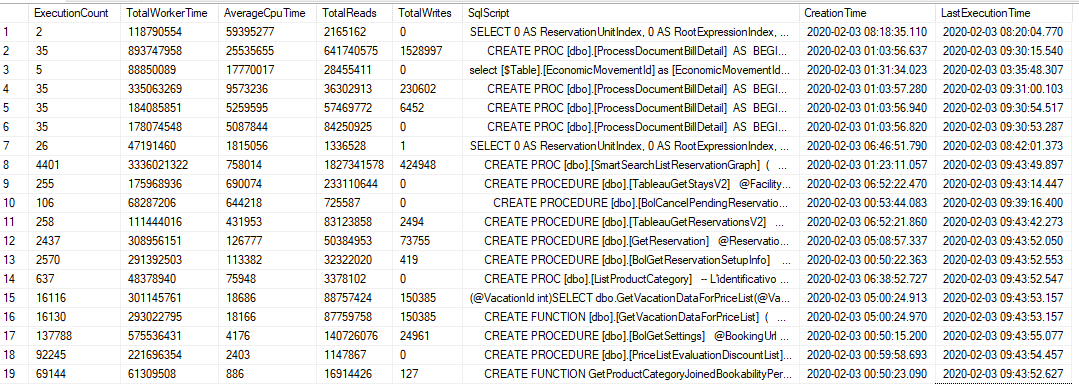
You can change the order of the results based on your needs.
- Average CPU time returns the queries that are consuming more CPU on a single execution.
- Total Worker Time returns the queries that are consuming more CPU in general.
- Execution Count returns the queries that are executed the most.
Often with this data you can find some of more common software bottlenecks, like a missing cache or a loop cycle writing single records.